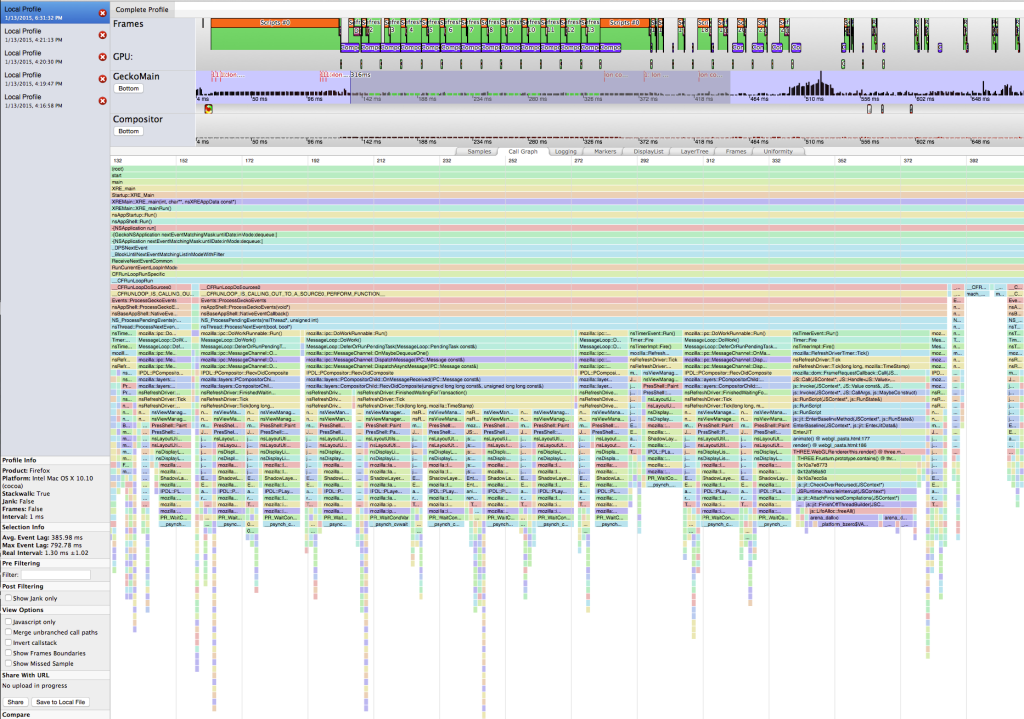
In the profiler you’ll now find a new tab called ‘CallGraph’. This will construct a call graph from the sample data. This is the same information that you can extract from the tree view and the timeline but just formatted so that it can be scanned better. Keep in mind that this is only a call graph of what occurred between sample points and not a fully instrumented Call Graph dump. This has a lower collection overhead but missing anything that occurs between sample points. You’ll still want to use the Tree view to get aggregate costs. You can interact with the view using your mouse or with the W/A/S/D equivalent keys of your keyboard layout.
Big thanks to Victor Porof for writing the initial widget. This visualization will be coming to the devtools profiler shortly.
