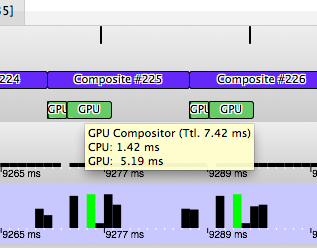
A quick remainder that one of the biggest benefit to having our own built-in profiler is that individual teams and project can add their own performance reporting features. The graphics team just landed a feature to measure how much GPU time is consumed when compositing.
I already started using this in bug 1087530 where I used it to measure the improvement from recycling our temporary intermediate surfaces.
 Here we can see that the frame had two rendering phases (group opacity test case) totaling 7.42ms of GPU time. After applying the patch from the bug and measuring again I get:
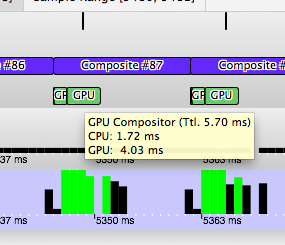
 Now with retaining the surface the rendering GPU time drops to 5.7ms of GPU time. Measuring the GPU time is important because timing things on the CPU time is not accurate.
Currently we still haven’t completed the D3D implementation or hooked it up to WebGL, we will do that as the need arises. To implement this, when profiling, we insert a query object into the GPU pipeline for each rendering phase (framebuffer switches).
Would be very nice indeed if we could profile our webgl code that way using https://www.khronos.org/registry/webgl/extensions/EXT_disjoint_timer_query/ ?
We need bug 974832 for that: https://bugzilla.mozilla.org/show_bug.cgi?id=974832